
I reviewed the H1 2026 releases, earnings calls and management interviews of the 100 largest listed fashion groups and tracked every mention of AI: whether it was there at all, what it was used for, and whether anyone attached a number to it.
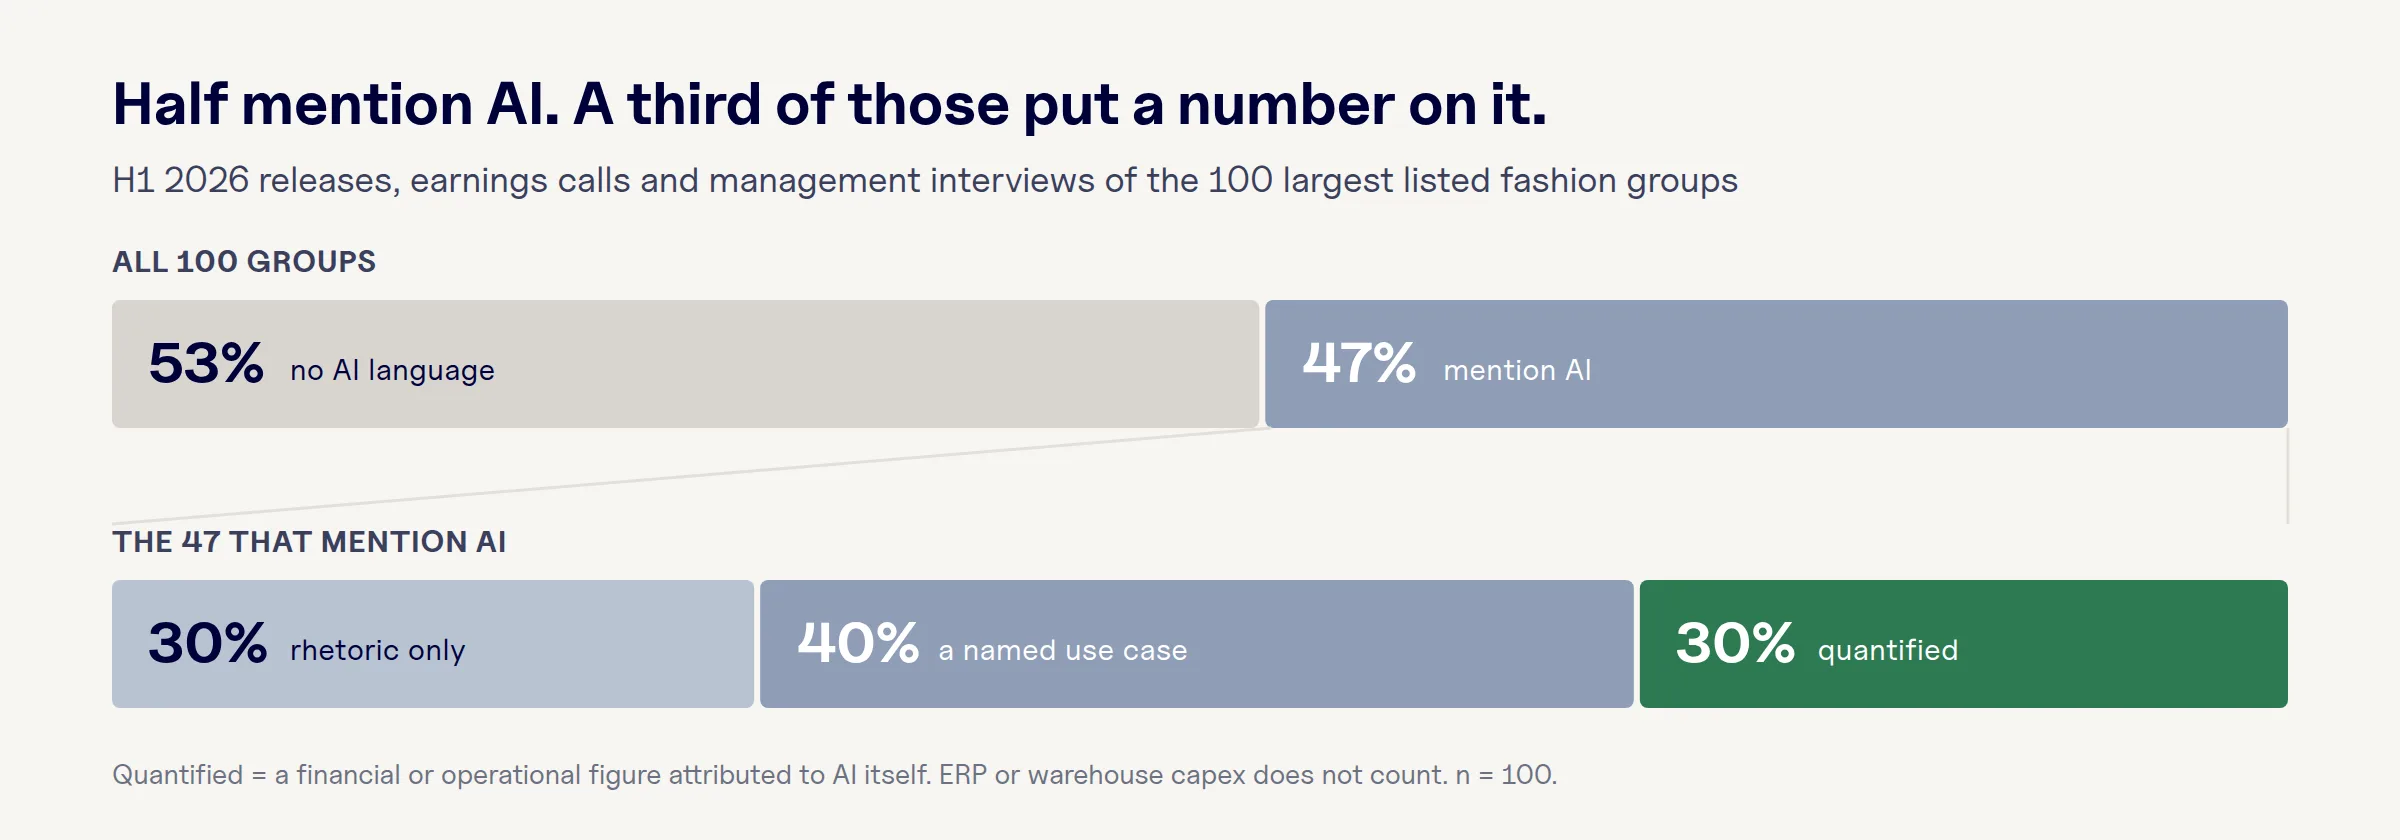
The headline: 47 of the 100 mention AI. AI in fashion is no longer experimentation. It is landing on the P&L. But the more interesting finding is who can prove it.
Half mention AI. A third of those put a number on it.
Of the 47 groups that mention AI, 14 stay at rhetoric (“we are leveraging AI across the business”). 19 name a use case but give no figure. Only 14 quantify a result: a margin, a cost, a cycle time, a share of decisions, attributed to AI itself. Fourteen companies out of a hundred.
That last group is the one that matters, and it’s small. To attach a number to AI, a company has to have chosen a specific decision, secured the data behind it, and put someone accountable next to the outcome. That is harder than getting a model to work. The 33 mentioners without a figure aren’t behind on AI. They’re behind on that.
It also means the gap won’t close on its own. Whether a programme can quantify its impact gets decided when the programme is scoped, not somewhere at the end.
Where AI is mentioned, and where it gets measured
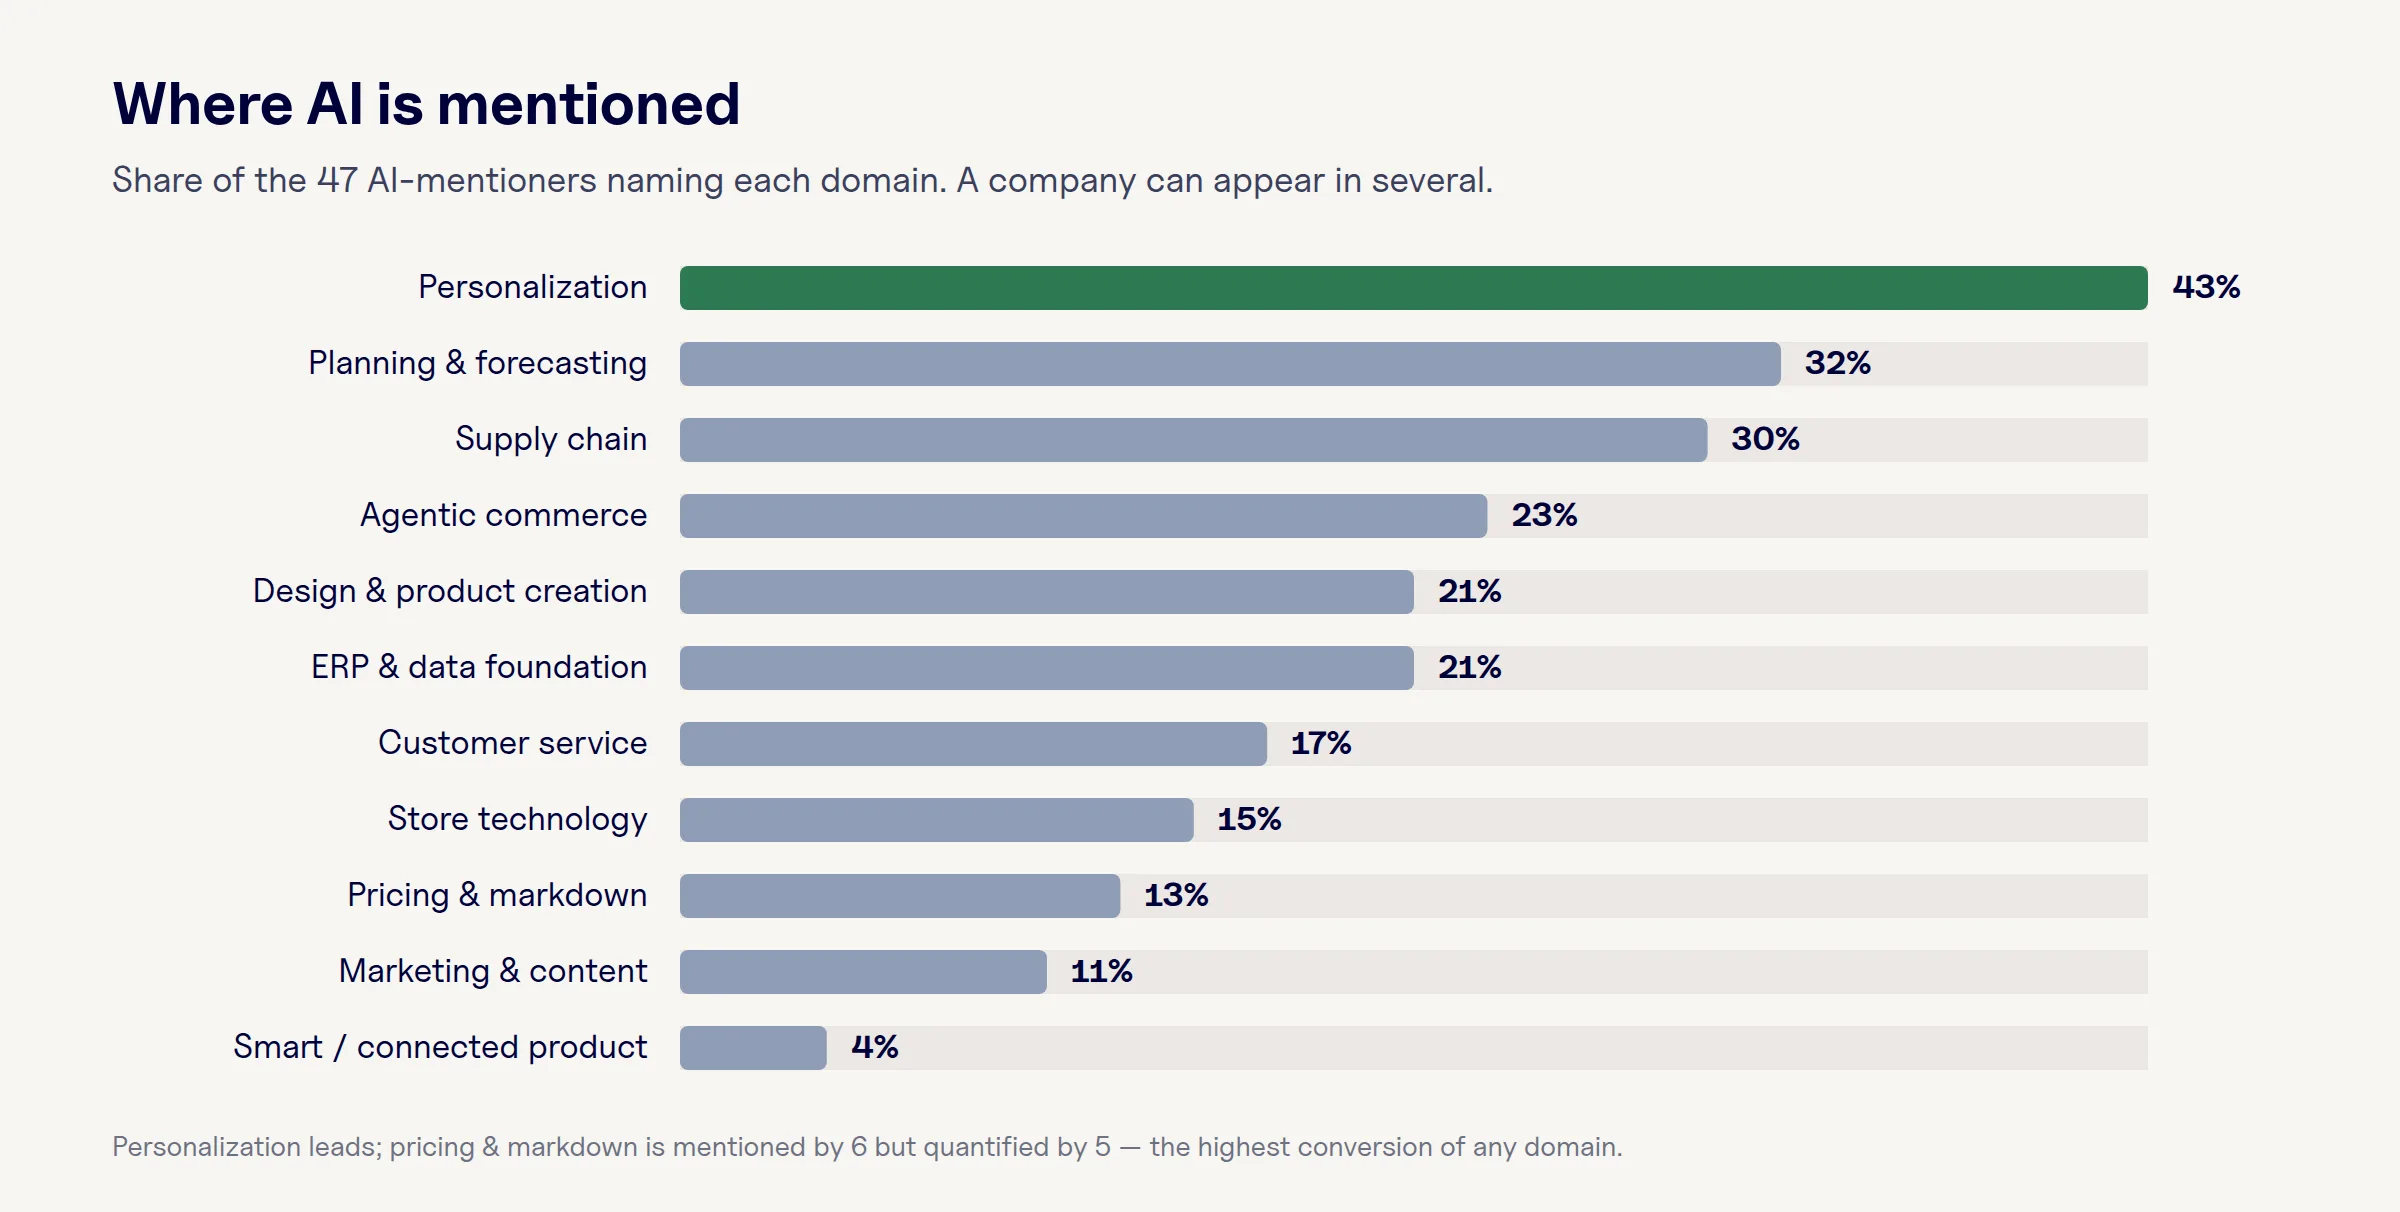
By volume of mentions, personalisation leads at 43% of the mentioners, with planning and forecasting, and supply chain, behind it. Agentic commerce, selling through or with AI assistants, is already at 23%. That is high for something that barely existed a year ago.
The more revealing reading is the gap between mention and measurement per domain. Pricing and markdown is named by only six companies, and five of them put a number on it. Planning and forecasting is named by fifteen and quantified by four. The pattern: numbers appear where the unit economics were already measured. Markdown yield, cost per contact, conversion. Where a company already reports a metric, it can report what AI did to it.
There is a practical lesson in that. If a decision has no baseline, you won’t be able to prove what AI did to it, no matter how good the model is. So when picking use cases, look at where your measurement is already in place. That is how most of the quantifiers got there.
Why digital natives quantify
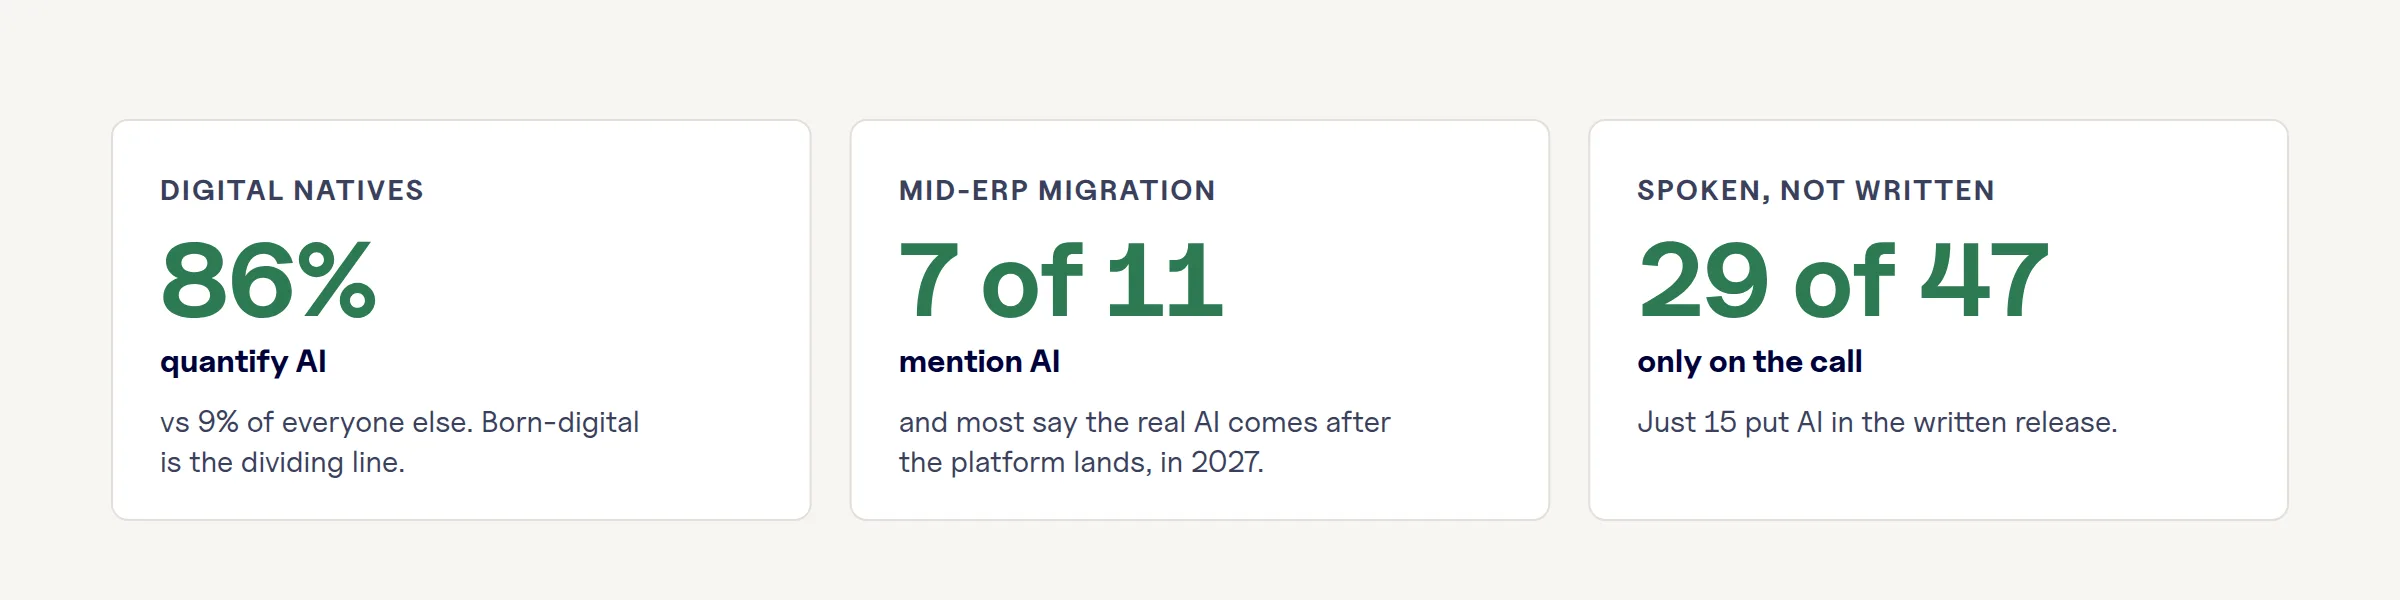
Six of the seven born-online groups in the set quantify AI. Nine percent of everyone else does.
The easy explanation is that digital natives are simply better at technology. I don’t think that’s the mechanism. Zalando and ASOS quantify because they already report on the numbers AI moves: cost per contact, markdown yield, conversion. And their data landscape is integrated enough that a model can actually reach the decision it needs to improve.
That advantage comes from how they are set up, which means other companies can build it too. You don’t need to be born online. You need the data layer connected to a decision you already measure.
Waiting for the platform
Around one in ten of the hundred is in active ERP migration or foundational data work, and seven of those eleven mention AI. Most say the same thing: the real AI comes after the platform lands, in 2027.
They’re half right. The platform does come first, for the decisions that run through it. But ASOS is mid-replatforming and still quantifies, because its wins sit in customer service and buying, on data it already had. “Foundations first” means the data layer for the specific decision, not the whole stack. There is no technical reason to wait for the full migration before quantifying anything, and doing so hands a season or two to competitors who scoped smaller.
Targeting the bottlenecks
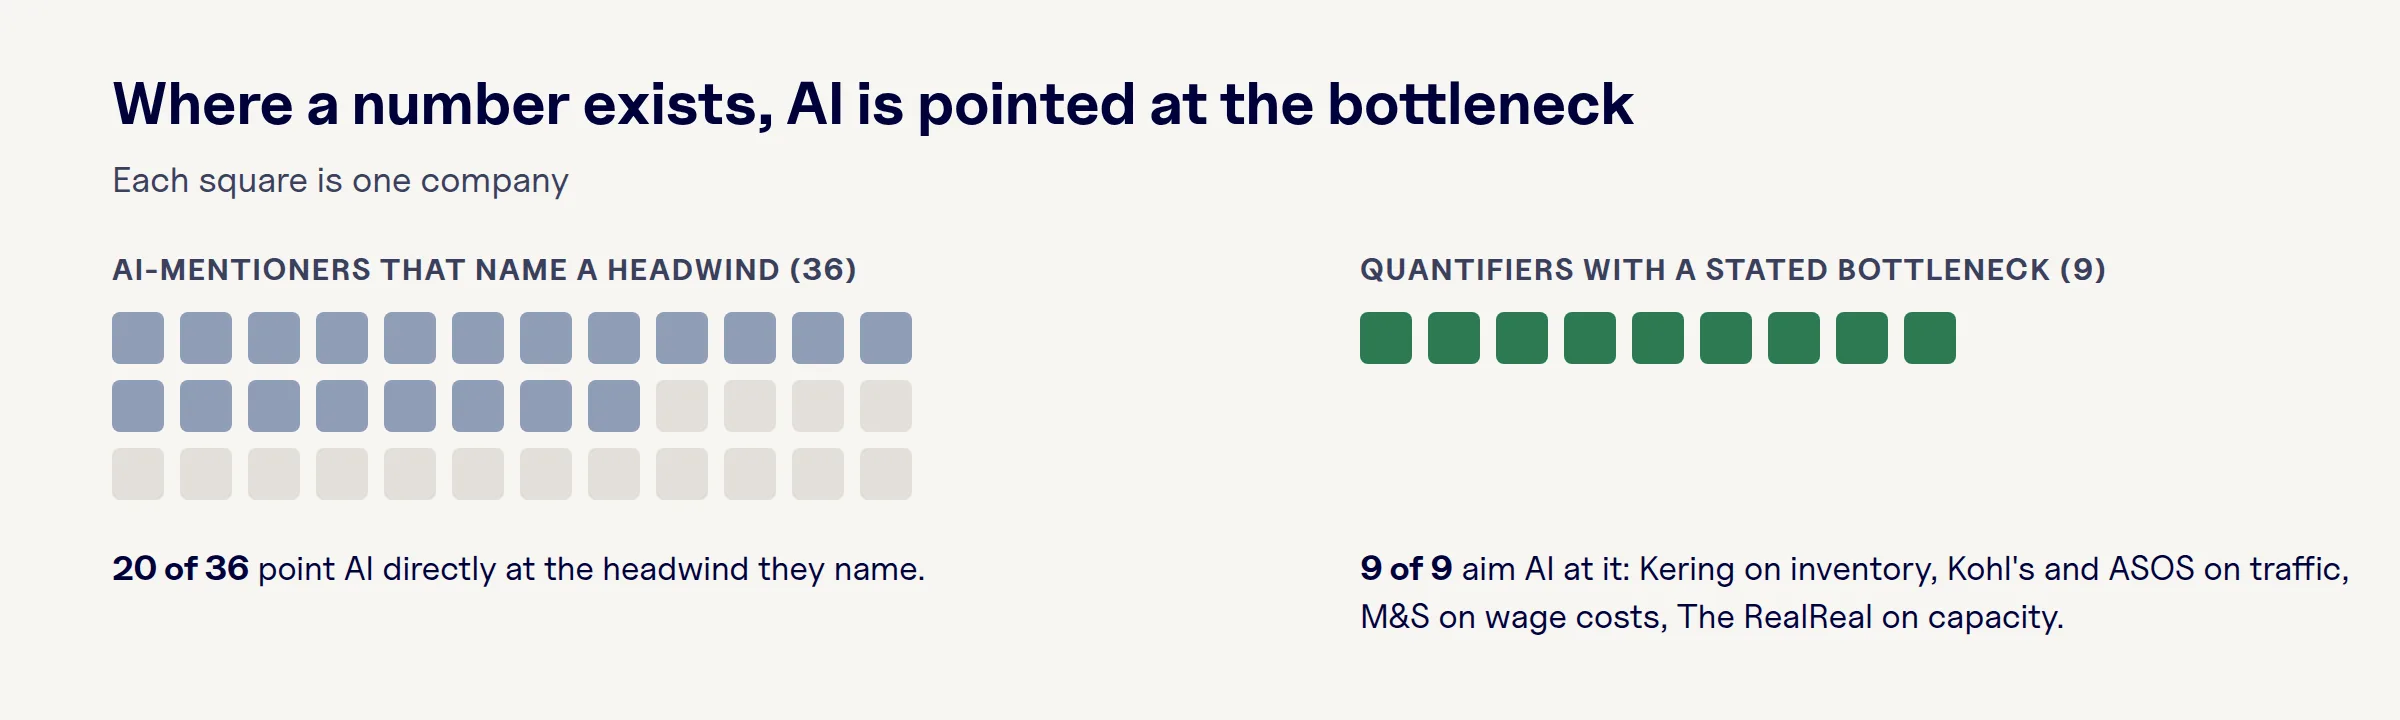
The clearest pattern in the whole set: of the 36 AI-mentioners that name a structural headwind (traffic, inventory, wage costs, capacity), 20 point AI straight at it. And every quantifier with a stated bottleneck does. Kering on inventory. Kohl’s and ASOS on traffic. M&S on wage costs. The RealReal on capacity.
The companies with numbers didn’t start with the technology and look for a place to put it. They started with the problem the CFO was already explaining to investors, and aimed AI at that. That approach has a built-in advantage: the bottleneck is already measured, someone already owns it, and the business case already exists. The model just has to move a number the company is already watching.
AI as the turnaround narrative
The most elaborate AI narratives of the season often belong to brands facing revenue headwinds, using the technology story to frame the fix. That isn’t a criticism. If you’re mid-turnaround, AI is a credible way to explain how costs come down and decisions get better without waiting for volume to return. But it does mean the loudest AI stories are not, by and large, coming from the companies with the best numbers.
A related tell: 29 of the 47 mentioned AI only on the earnings call or in an interview. Just 15 put it in the written release. Management is still more comfortable talking about AI than printing it. Understandable: what goes into the written release is what they expect to be held to next season. So a useful signal for H2 is which companies move their AI claims from the call transcript into the release.
Key reported results
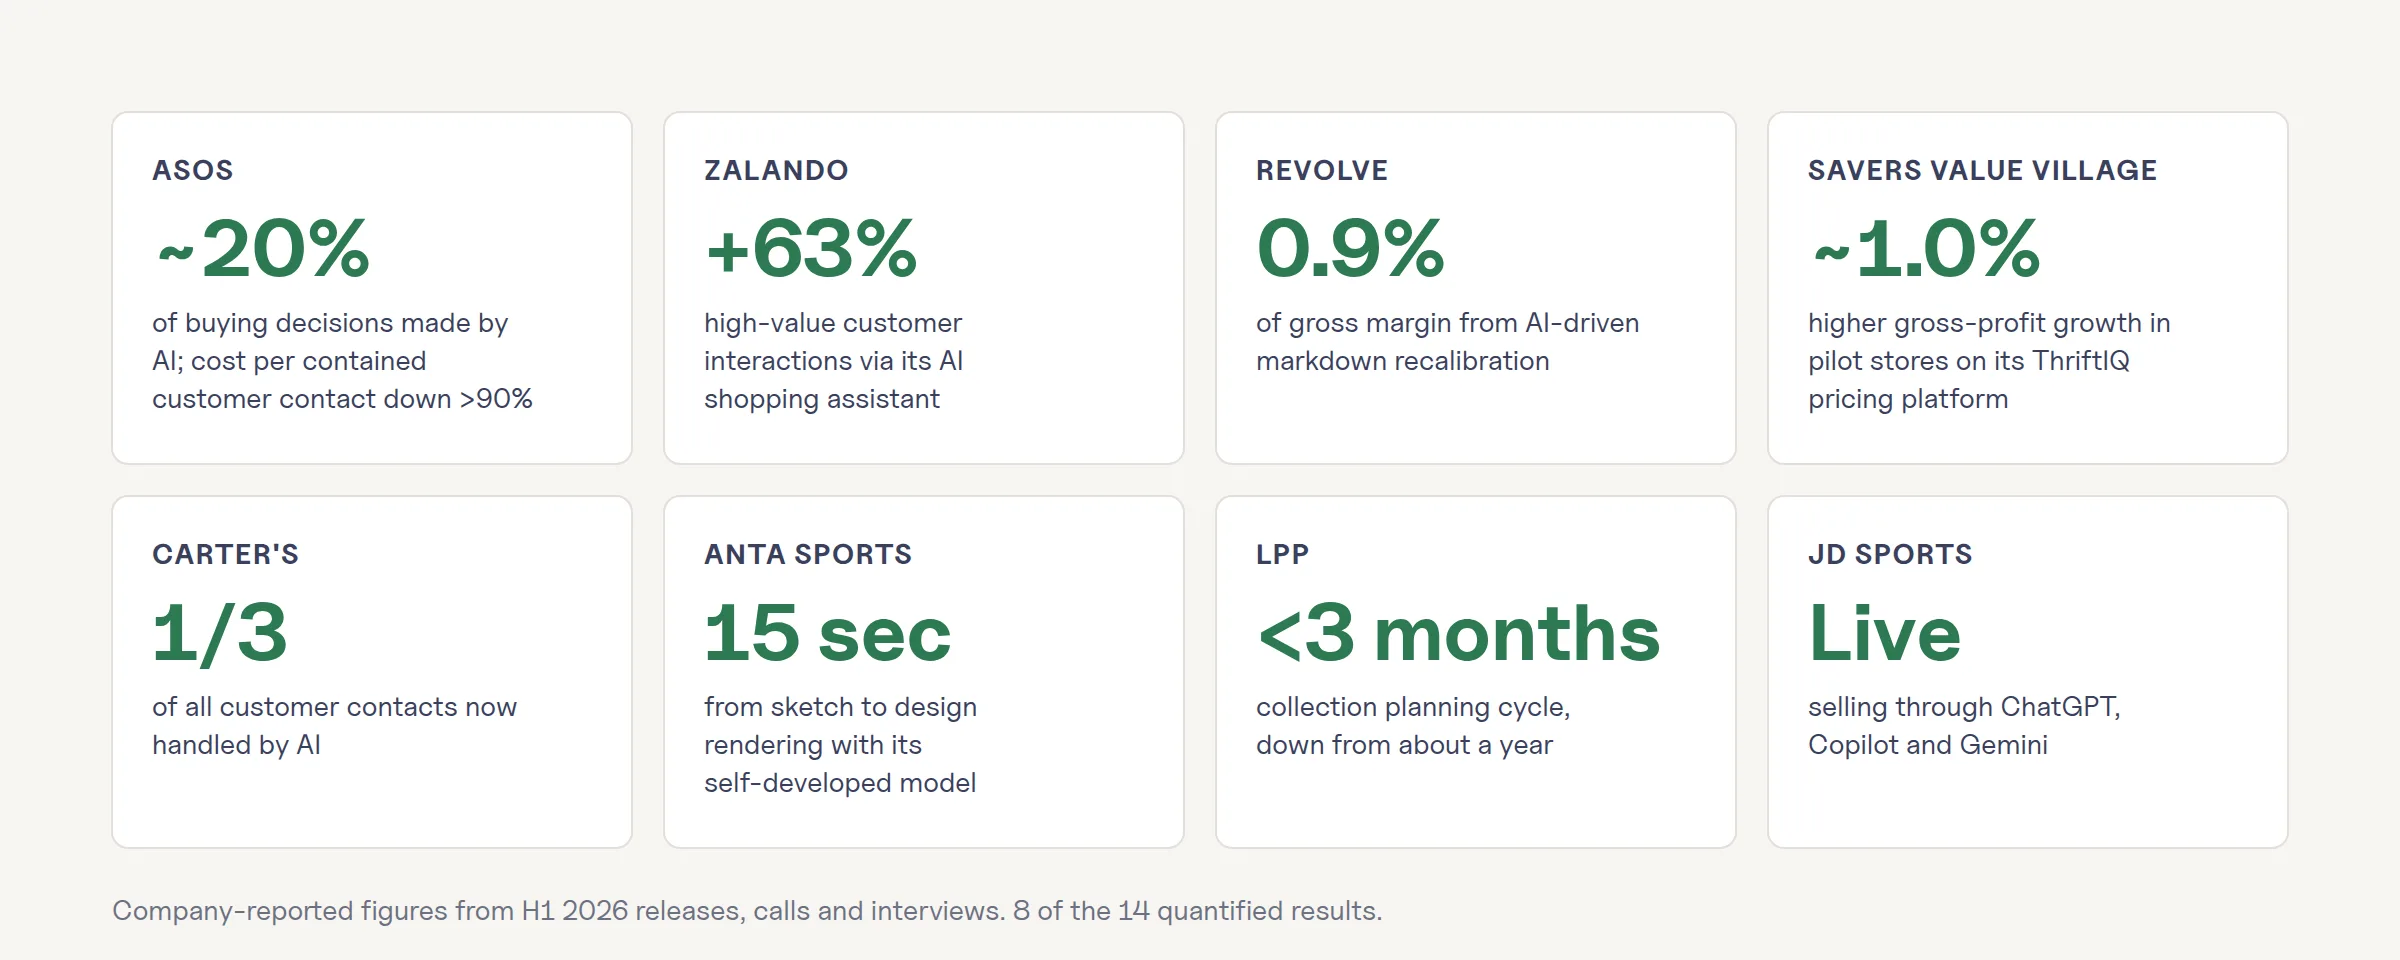
Some of the highlights, in the companies’ own terms:
- ASOS: AI now makes ~20% of buying decisions; cost per contained customer contact down more than 90%
- Zalando: +63% high-value customer interactions through its AI shopping assistant
- Revolve: AI-driven markdown recalibration worth about 0.9% of gross margin
- Savers Value Village: AI pricing platform delivering ~1.0% higher gross-profit growth in pilot stores
- Carter’s: one third of all customer contacts now handled by AI
- ANTA Sports: sketch to design rendering in 15 seconds
- LPP: collection planning cycle down from about a year to under three months
- JD Sports: live on ChatGPT, Copilot and Gemini, one of the first retailers selling through AI assistants
Notice what these have in common. They are business metrics, not AI metrics. Margin, gross profit, cost per contact, cycle time, share of decisions. AI is the explanation, not the headline.
Method and caveats
Scope. The 100 largest listed fashion and apparel groups by revenue, across luxury, sportswear, value, department stores, off-price and online. Sources: H1 2026 (or equivalent interim) releases, earnings-call transcripts and management interviews published up to 2 September 2026. One period, one reporting season.
Scoring. Each company was scored 0–3: no mention; rhetoric only; a named use case; a quantified result. “Quantified” requires a financial or operational figure attributed to AI itself. Investment in ERP, data platforms or warehouse automation counts as a named use case, not a quantified result.
Domains. Eleven domains: personalisation, planning & forecasting, supply chain, agentic commerce, design & product creation, ERP & data foundation, customer service, store technology, pricing & markdown, marketing & content, smart/connected product. A company can appear in several.
Caveats. All figures are company-reported and unaudited; several are pilot-stage or self-selected. Companies with no AI language in H1 may have disclosed elsewhere. Where a claim could not be verified in a primary source it was scored one tier lower. The full company-level table underlies every figure above.
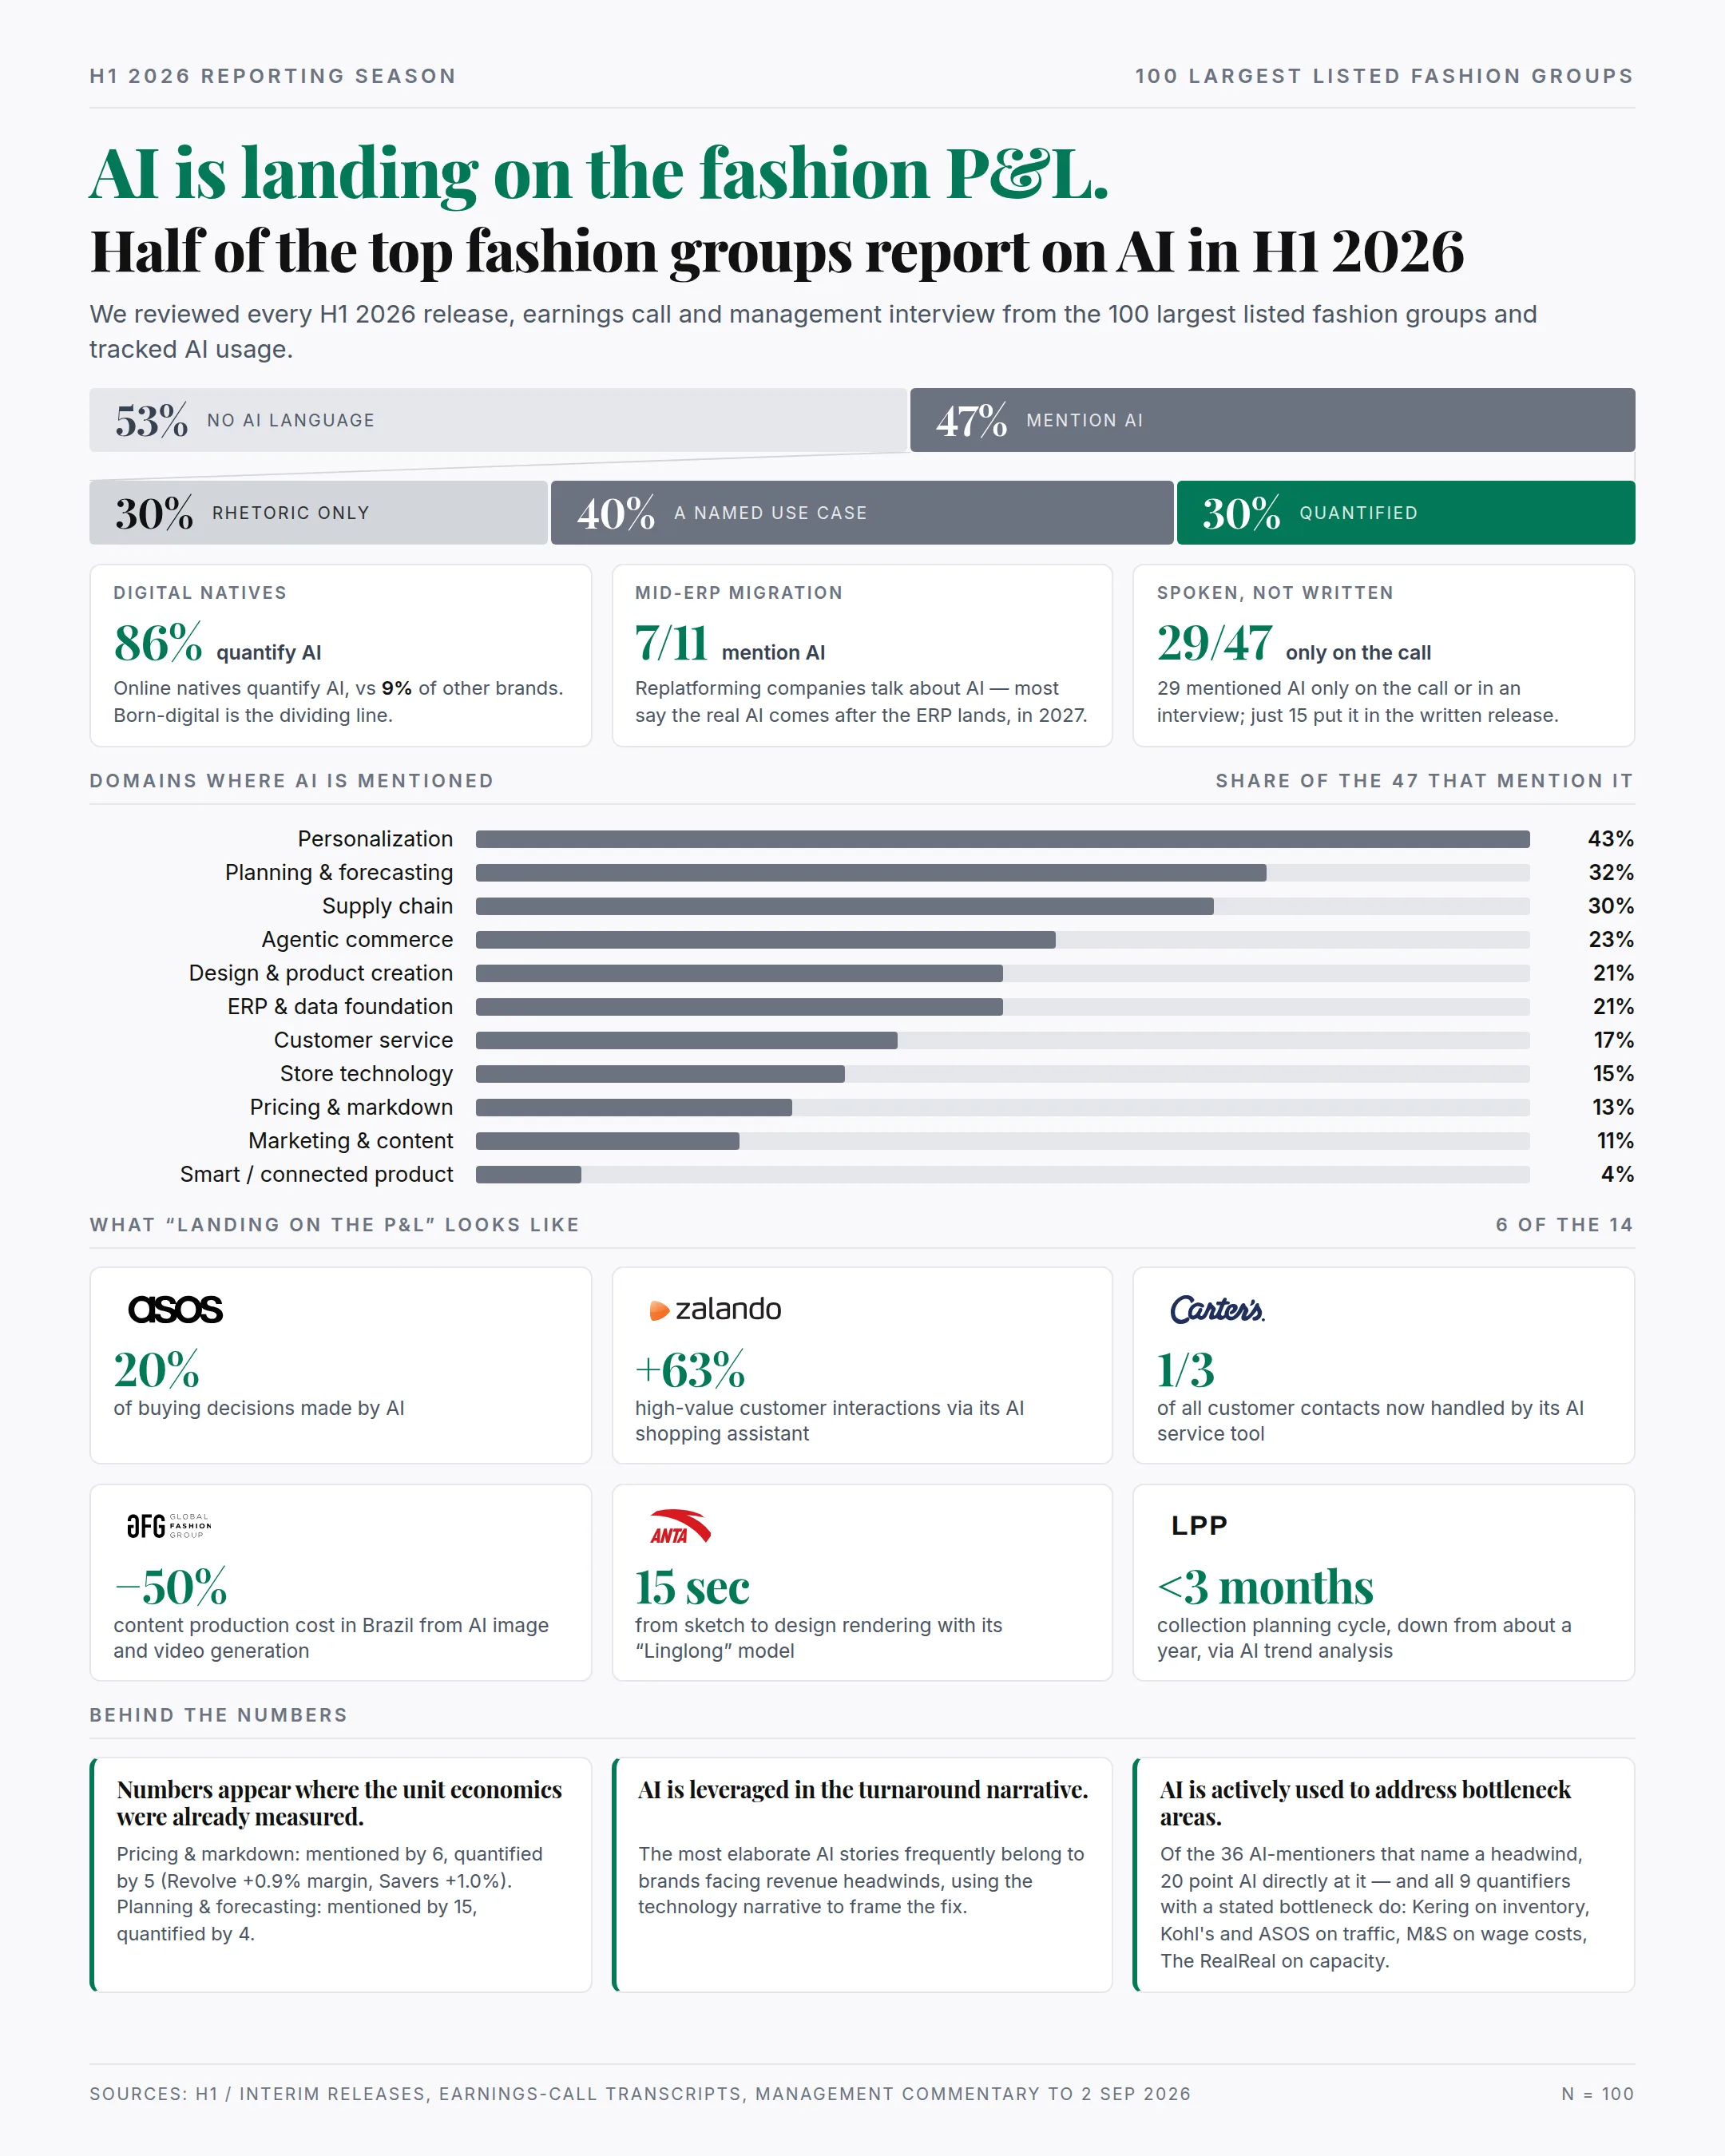
One-page summary of the findings.